How to Read a Bubble Map
The tool that turns a holder list into a picture. What the clusters mean, and where it stops being reliable.

Merlin
Author
A holder list tells you who holds what. It doesn't tell you whether twenty of those holders are the same person. A bubble map does, or at least tries to, and it's the fastest way to see through a distribution that's been engineered to look clean.
What you're looking at
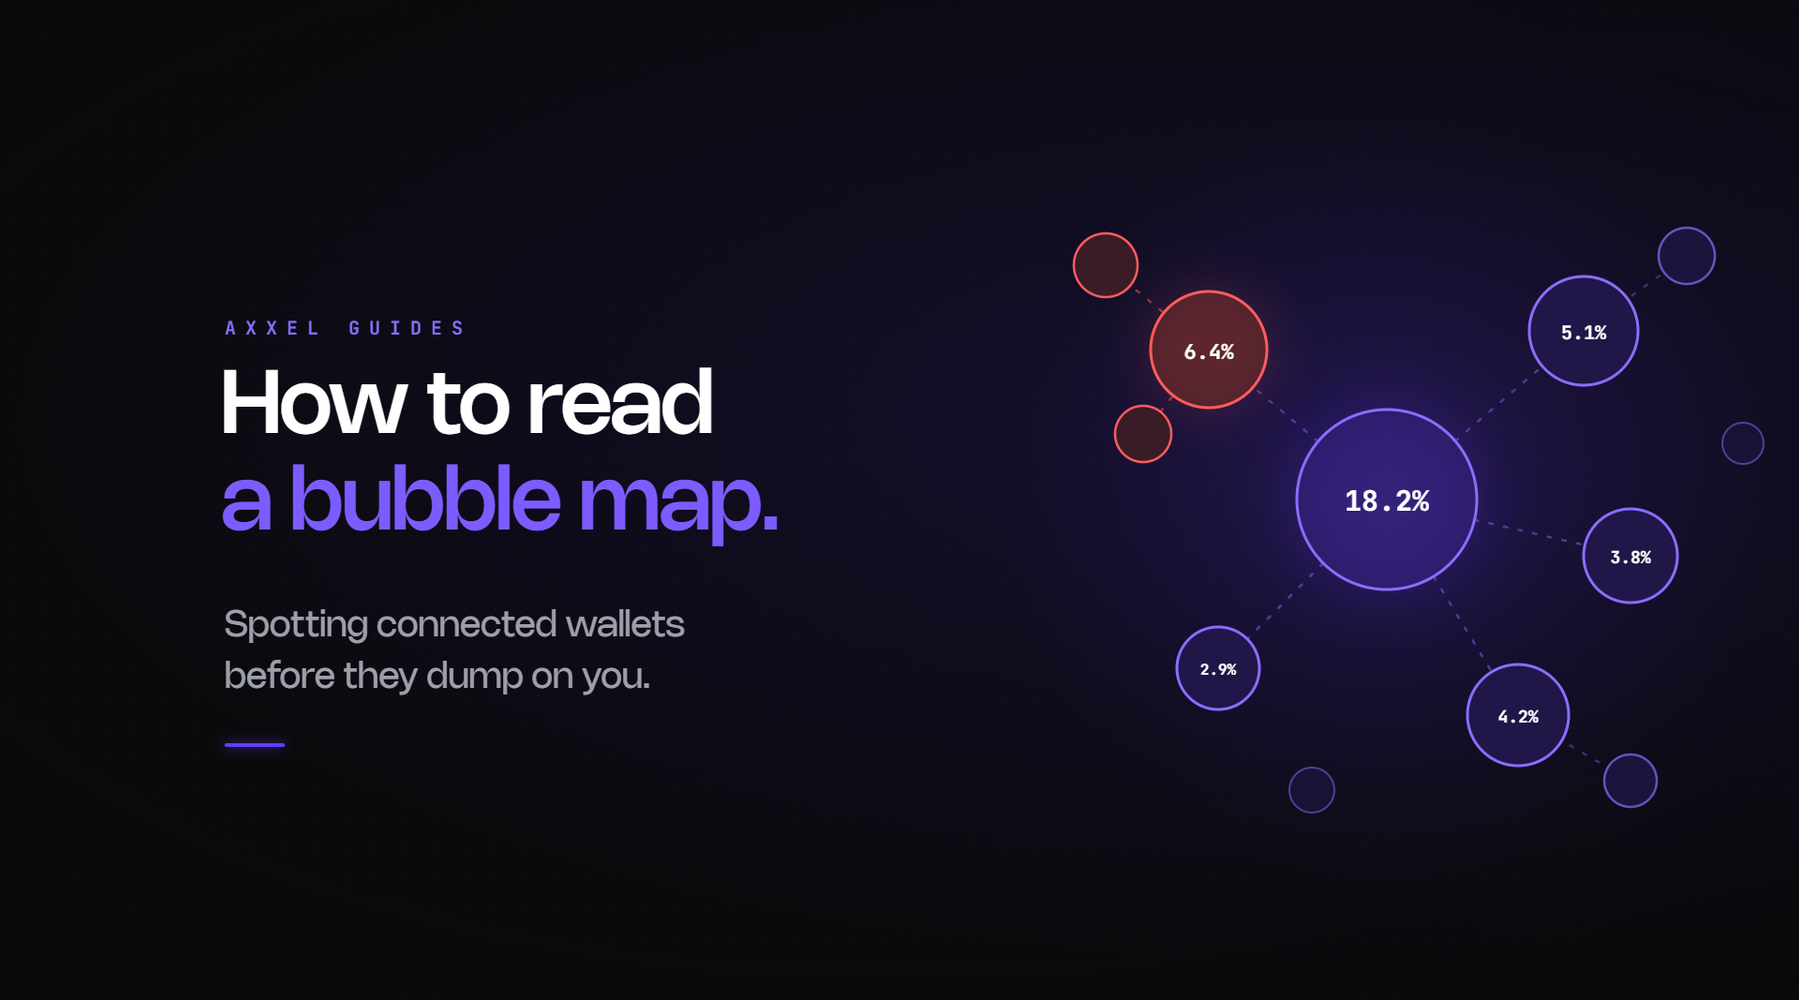
Each bubble is a wallet, sized by how much of the supply it holds. Lines between bubbles are transfers, meaning tokens or funds moved directly between those addresses. Bubbles with lines between them get pulled into clusters.
A cluster is a set of wallets that have transacted with each other. The map's implicit claim is that connected wallets are likely controlled by the same entity, which is often true and not always.
The four patterns
One large cluster holding a big share. Several wallets, all connected, together holding 30% or more of supply. This is what a bundle looks like after the fact. The supply was distributed across addresses at launch to look spread out, and the transfers between them are the evidence.
Many small unconnected bubbles. The healthy picture. Lots of holders, no clusters of note, largest bubble a few percent. Genuine distribution, or at least distribution that wasn't manufactured through direct transfers.
A chain of transfers. A leads to B leads to C leads to D. Someone moving supply through hops to obscure the origin. More effort than a single cluster, same conclusion.
One big bubble, everything else tiny. A single wallet holding a large share. Check what it is before reacting, because it's frequently a pool contract, a burn address, or a locker, all of which are fine. The map shows size, not intent.
How to use it in practice
Open the token, look at the largest cluster, note what percentage of supply it controls. Under 10% is normal. 10 to 25% is worth understanding. Over 25% in one connected group is the single most predictive risk signal available.
Then click into the biggest bubbles individually. Are they pool contracts and burns, or are they wallets created the day the token launched?
That's about ninety seconds and it's the visual version of the holder distribution checks.
Where it's unreliable
Worth being clear on this, because the tool is good enough that people trust it more than they should.
It only shows direct transfers. Two wallets funded from the same exchange withdrawal address, with no transfers between them, aren't connected on the map. They're connected in reality. The funding trail catches what the map misses.
Exchange wallets create false clusters. A large exchange hot wallet has sent funds to millions of addresses. If two holders both withdrew from it, the map may link them. They're not the same person; they both use Binance.
Bundlers now build for it. Bundling software is explicitly marketed as defeating bubble maps. It funds wallets through separate paths, gives them unrelated token histories so they don't read as fresh, and avoids direct transfers between them. A launch built with that tooling looks clean on the map and isn't.
Timing matters. The map shows current state. A bundle that's already distributed to buyers will look more spread out than it was at launch. Some tools let you view historical snapshots, which is worth using on anything that's had time to sell.
What it's actually for
A bubble map catches the ordinary version of supply concentration, which is most of them, in seconds. It doesn't catch the careful version, and it produces false positives around exchanges.
So it's a first pass rather than a verdict. Something that looks bad on the map is worth walking away from without further work. Something that looks clean is worth the explorer check before you trust it, particularly on a fresh launch where the tooling to fool it has had time to be applied.
The sequence is in the five-minute research routine, where the map sits between the holder count and the contract panel.
Axxel includes token analysis alongside market, limit, trailing and sniper orders, stop loss and take profit, MEV protection and configurable slippage and tax limits across Ethereum, Base, BSC, Solana and Robinhood Chain. Flat 0.9%, non-custodial, no subscription.
The map shows you who talked to whom. It doesn't show you who they are.
Crypto trading carries risk. Most memecoins lose value. Nothing here is financial advice. Axxel is not available in all regions.